Chartdeck Dashboards from CSV, databases and APIs, with an AI analyst
Bring data in from files, databases, APIs, FTP, accounting software or your other Ultrazaps apps, join it, and build filterable dashboards you can present, share, embed and email on a schedule. A built-in AI analyst explains what the numbers show.
What Chartdeck does
- Connect databases, APIs and files
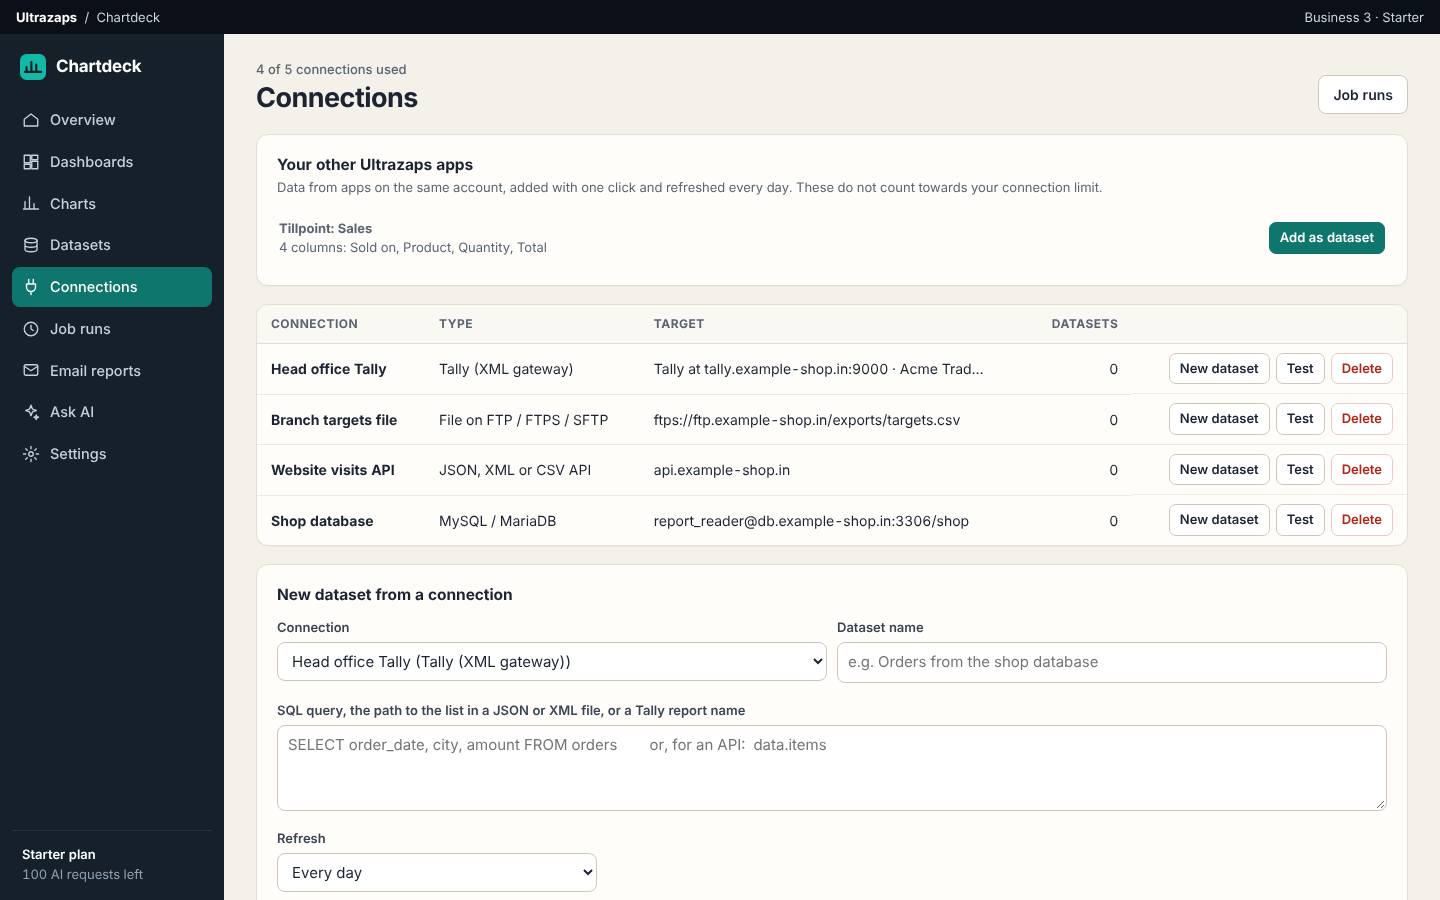
- Read from MySQL, MariaDB or SQL Server with a SELECT query, from JSON, XML or CSV APIs, from a file on an FTP, FTPS or SFTP server, or from your other Ultrazaps apps. Upload CSV, XML or JSON files as well.
- Accounting data plugin
- Pull ledgers, groups, stock items and vouchers from a Tally XML gateway, or upload an XML export from your accounting software and have its records turned into rows.
- Scheduled refresh with job runs
- Refresh connected datasets hourly, daily or weekly, or on demand. Each run is logged with its time, row count and any error.
- Joins across datasets
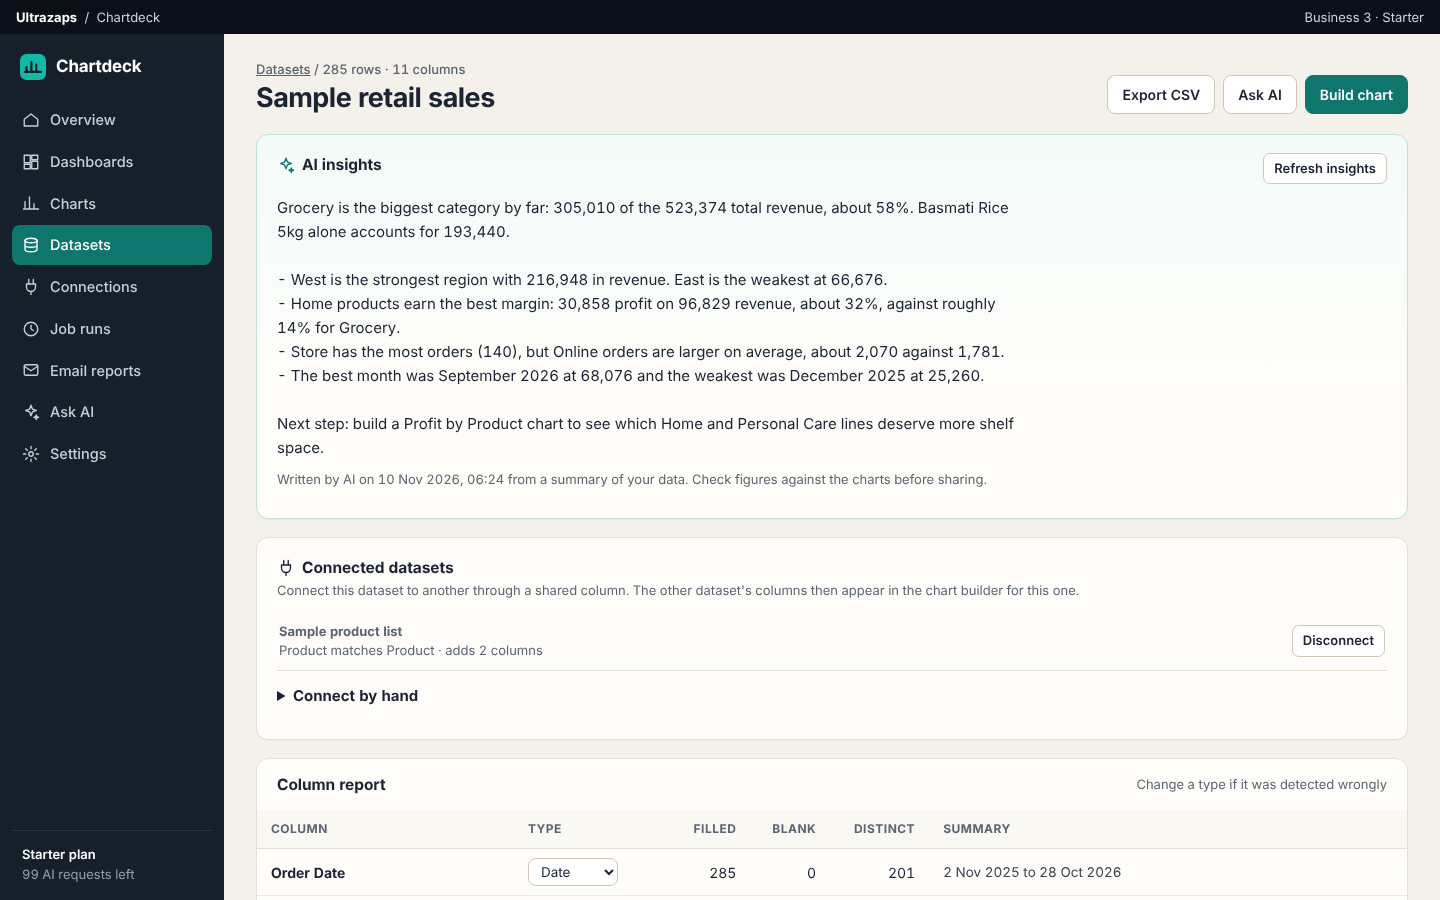
- Join a dataset to up to six others through shared columns, and chain joins from one dataset to the next. Likely matches are suggested for you.
- Fourteen chart types
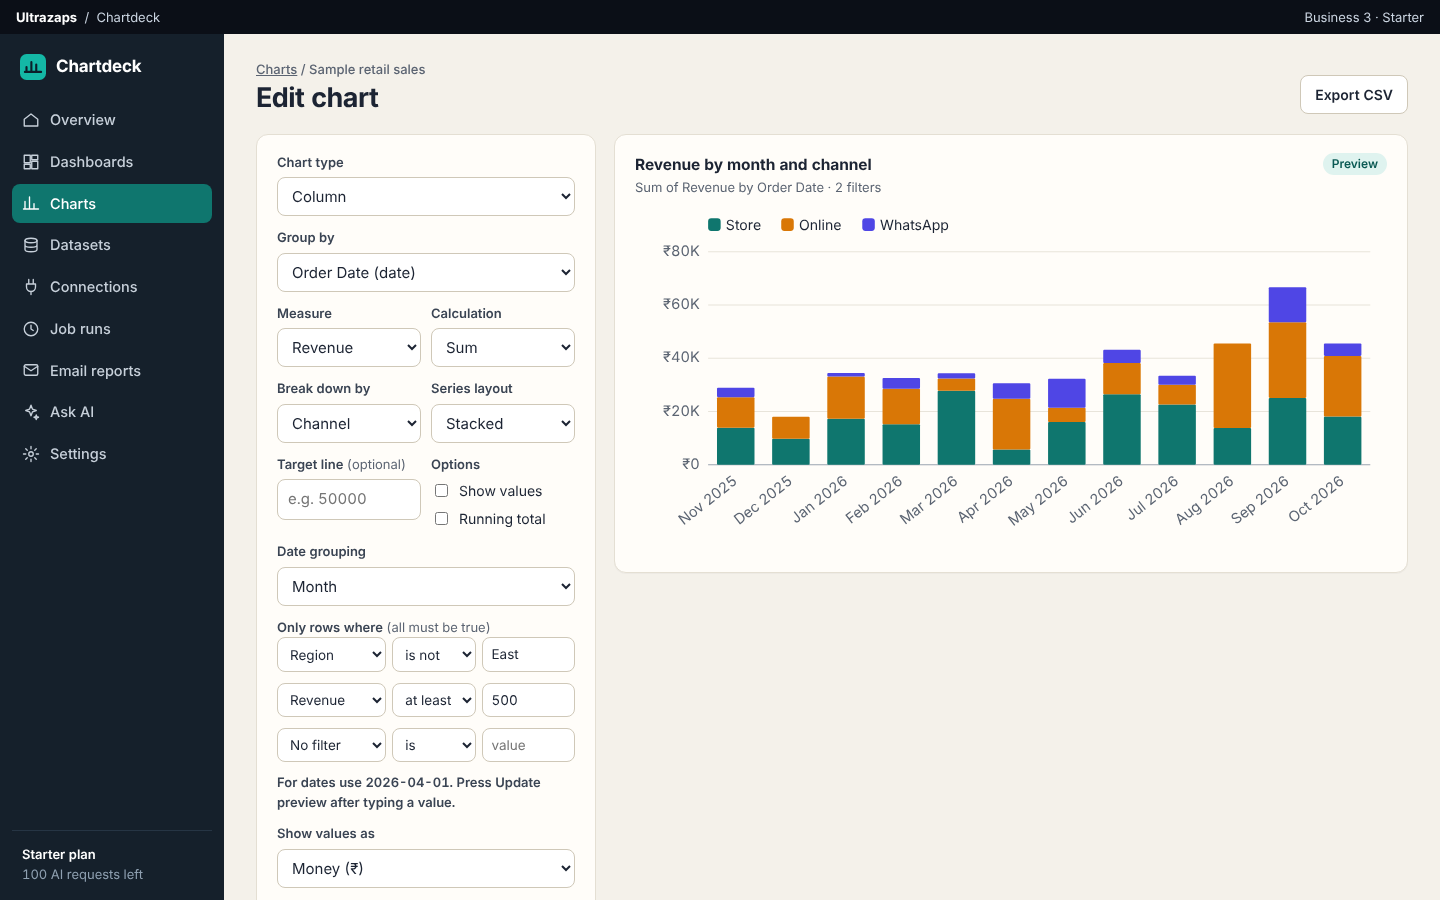
- Column, bar, line, area, donut, scatter, pareto, funnel, treemap, heatmap, gauge, single numbers, summary tables and plain data tables, with series, targets, labels and running totals.
- Filters everywhere
- Give a chart up to five filters with comparisons such as contains, at least or is not. Each dashboard also has a filter bar and date range that apply across all its datasets.
- Present, share and embed
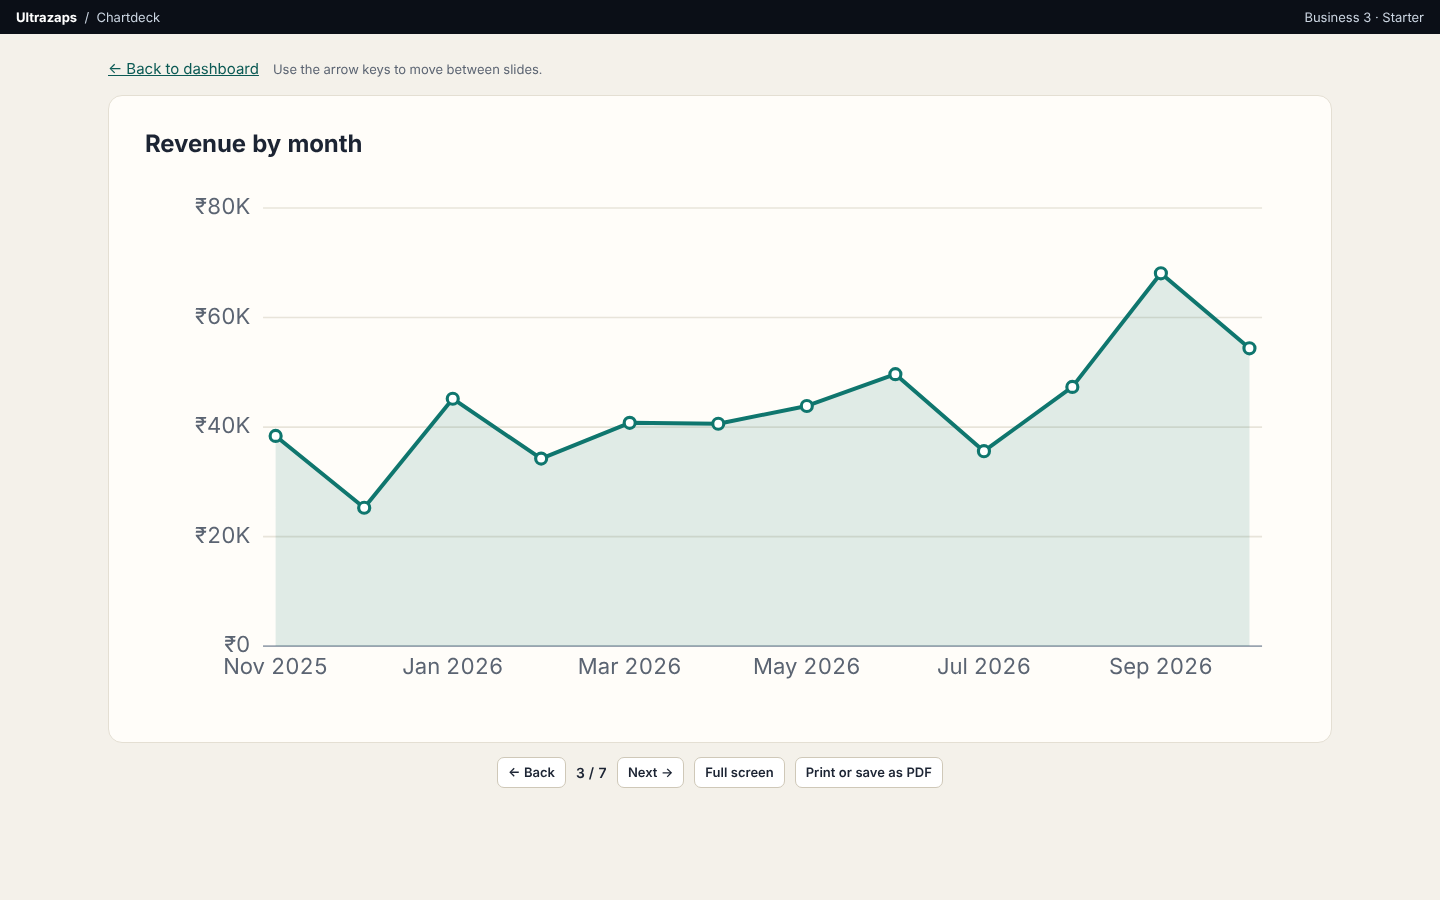
- Open a dashboard as slides, save it as PDF, create a view-only link, embed it in your website, or list shared dashboards on your organisation's workspace page.
- Logo and linked dashboards
- Add your logo to a dashboard and place buttons, with an optional image, that take viewers to the next dashboard.
- Scheduled email reports
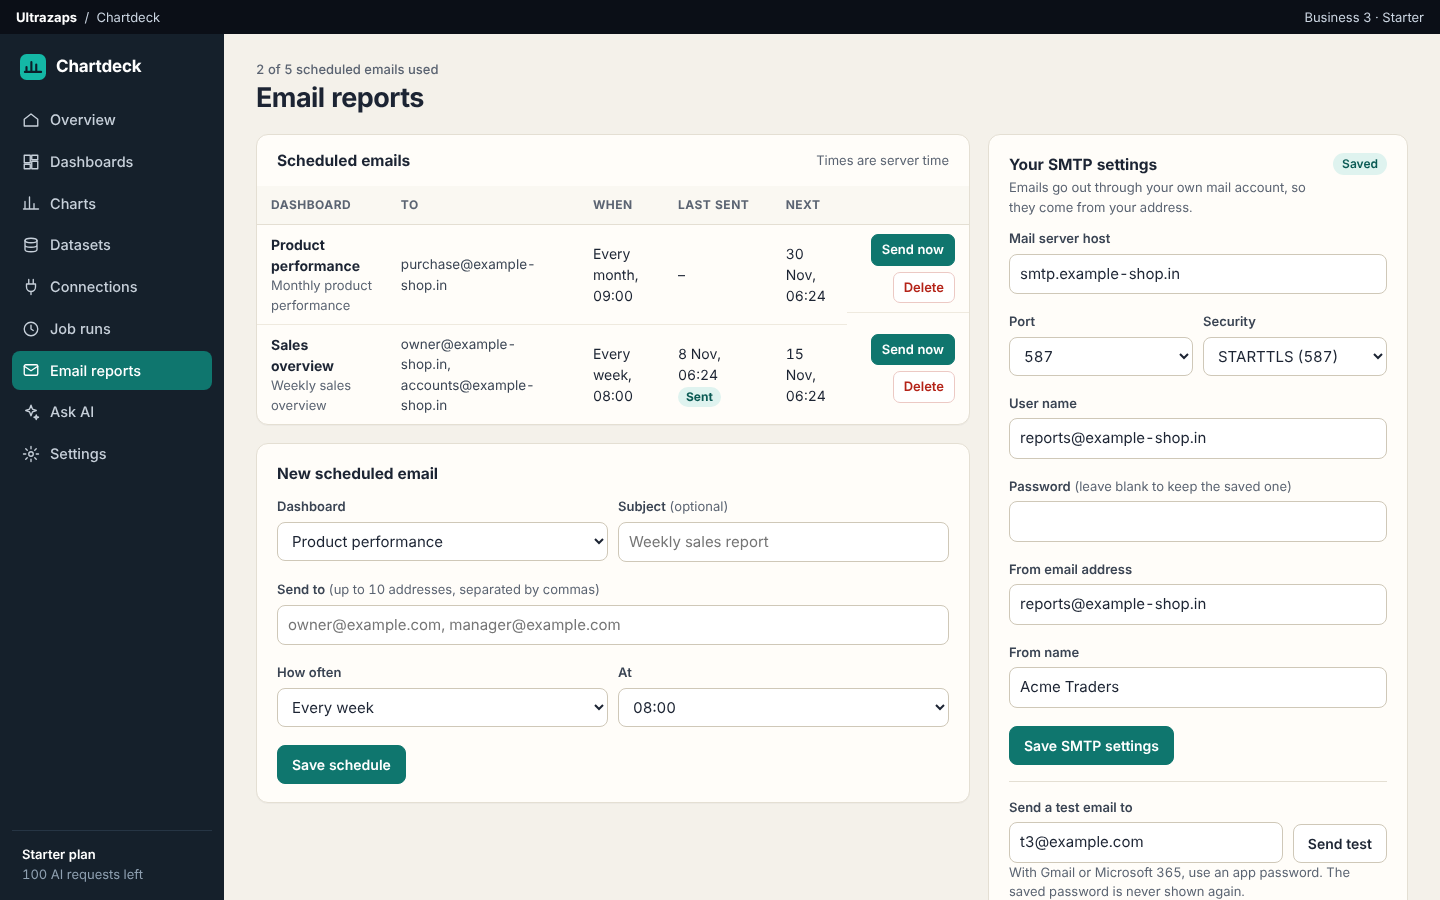
- Enter your own SMTP settings and email a dashboard's figures daily, weekly or monthly to up to ten people, with the numbers attached as CSV.
- AI analyst
- Ask questions in plain English, get written insights for a dataset and a short review of any dashboard, based on a summary of your data.
How it helps
Chartdeck is a dashboard tool for business owners. Data can come from a CSV, XML or JSON upload, a MySQL or SQL Server database, an API, a file on an FTP server, a Tally XML gateway or export, or another Ultrazaps app on the same account. Connected data refreshes on a schedule you choose, and every refresh is logged under Job runs.
Datasets can be joined to each other through shared columns such as a product or customer code. A dataset can have several joins, joins can chain from one dataset to the next, and Chartdeck suggests likely matches itself. Joined columns appear in the chart builder alongside your own.
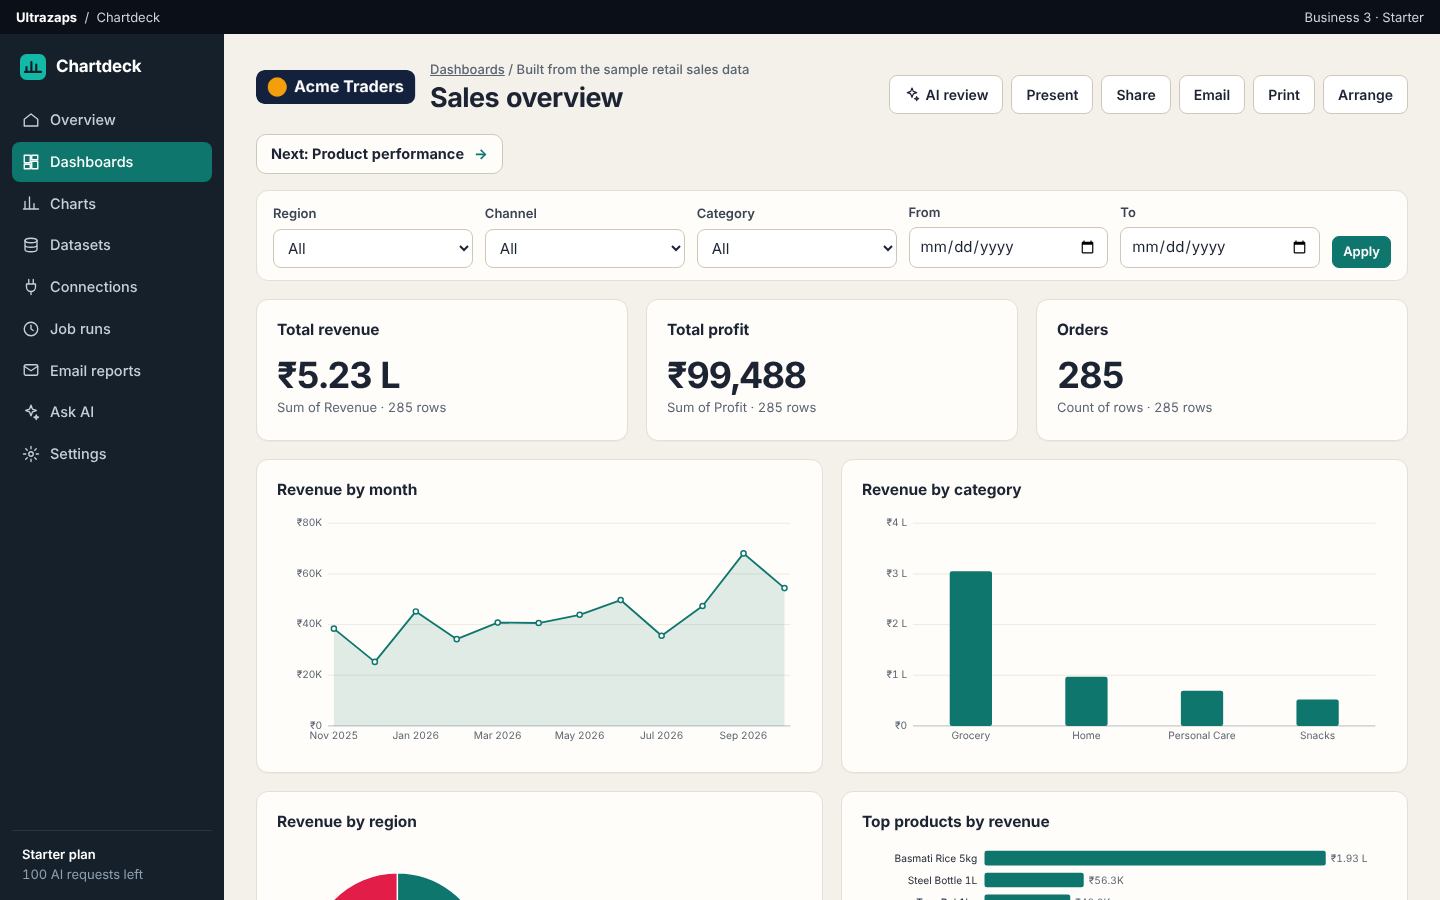
Fourteen chart types are included, from column, line and donut charts to treemaps, heatmaps, gauges and plain data tables that list rows without grouping. Charts take several filters at once, series breakdowns, value labels, running totals and target lines. Each dashboard has its own filter bar that applies across every dataset behind it, plus an optional logo and buttons that lead to other dashboards.
A dashboard can be presented as slides, printed or saved as PDF, shared through a view-only link, embedded in your website, or emailed on a schedule through your own SMTP account. The AI analyst writes observations, reviews dashboards and answers questions about your data. Everything else works without AI, and all data can be exported as CSV.
Who uses it
- Retail shops reviewing monthly sales by category and product from a POS export
- Distributors and wholesalers tracking revenue by region, dealer and sales rep
- Online sellers comparing orders and revenue across channels and marketplaces
- Restaurants and cafes looking at item-wise sales and daily trends
- Service businesses and agencies reporting billing by client and month
- Accountants and bookkeepers preparing simple client dashboards from ledgers
Screens
Chartdeck plans and limits
Prices in Indian rupees per month. Pay for 12 months and get 2 free. Paid plans do not renew on their own; when one ends, the app returns to free-plan limits and your data stays.
Free
Free
- 3 datasets
- Up to 1,000 rows per dataset
- 1 dashboard
- 1 database, API, FTP or Tally connection
- 1 share or embed link
- 1 scheduled email report
- 10 AI requests a month
- Unlimited charts, presentations and CSV export
Starter
₹499/month
- 10 datasets
- Up to 10,000 rows per dataset
- 5 dashboards
- 5 database, API, FTP or Tally connections
- 10 share or embed links
- 5 scheduled email reports
- 100 AI requests a month
- Unlimited charts, presentations and CSV export
Pro
₹1,499/month
- 50 datasets
- Up to 25,000 rows per dataset
- Unlimited dashboards
- 20 database, API, FTP or Tally connections
- Unlimited share or embed links
- 25 scheduled email reports
- 500 AI requests a month
- Unlimited charts, presentations and CSV export
Questions about Chartdeck
How much does Chartdeck cost?
There is a free plan. Starter is ₹499 a month and Pro is ₹1,499 a month. Plans differ in the number of datasets, rows per dataset, dashboards, connections, share links, scheduled emails and AI requests each month.
What can I do on the free plan?
The free plan includes 3 datasets of up to 1,000 rows each, 1 dashboard, 1 connection, 1 share link, 1 scheduled email, unlimited charts and 10 AI requests a month.
Which data sources can I connect?
CSV, XML and JSON files, MySQL and MariaDB, Microsoft SQL Server, APIs over HTTPS, files on FTP, FTPS or SFTP servers, a Tally XML gateway, and other Ultrazaps apps on your account. Databases, FTP servers and Tally must be reachable from the internet; otherwise upload an export file.
How often does connected data refresh?
You choose hourly, daily, weekly or manual for each dataset. You can also press Refresh now at any time. The Job runs page shows every refresh and why any failed.
Can I email dashboards automatically?
Yes. Enter your own SMTP settings once, then schedule a dashboard to be emailed daily, weekly or monthly. The email carries the headline figures, a table per chart and a CSV attachment. Charts appear as tables because email programs do not display live charts.
Can I get my data out again?
Yes. Every dataset can be downloaded as CSV, and so can the figures behind each chart and the list of your chart definitions.
Does it work on a phone?
Yes. Dashboards, presentations and the Ask AI screen work in a mobile browser from 360px wide. Building charts is more comfortable on a tablet or computer.